Fifty-five Percent of Companies Use this One Method to Measure Customer Happiness
Fifty-five percent of people measure customer happiness in exactly the same way based on a recent survey I conducted.
They’re all using this quick way to get a sense of customer sentiment about a product by asking only one question.
Surprise, surprise. (drum roll please!)
It’s Net Promoter Score® (NPS) surveys.
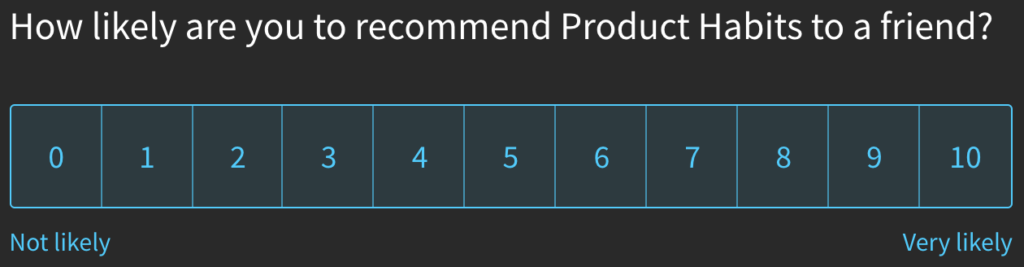
NPS has been in use since 2003, which is why I assumed there’d be more people using newer methods to understand how happy customers are. Well, they’re not.
I was shocked to learn that NPS is still the bread and butter for measuring customer happiness. Here’s a breakdown of the methods people are using:
55% Net Promoter Score
15% Customer Interviews
11% Retention
6% Customer Reviews
6% CSAT
6% Don’t Measure
5% Renewals
5% Churn
4% Referrals
3% Monetization
Here’s what a few people who responded had to say about NPS:
“We measure NPS and retention as our primary metrics around customer happiness, but we go one step further and actually if they give us a 9 or 10, we also ask them if someone went above and beyond on their behalf (giving our staff a shout-out) and also if they would be willing to allow us to utilize them as a testimonial.”
“We use the Net Promoter Score. This is delivered via a pop-up message in our web app.”
“Currently we measure customer happiness just using a monthly NPS. We send out the NPS via email through our home-grown intranet. We send it out to 1/12 of our accounts monthly, so that each account submits an NPS rating once a year.”
Many of the people who said they measure NPS scores also take action on them to get value from NPS that’s beyond the score itself. Here are a few examples of actions people take:
“I’m doing NPS surveys, but mostly to sort people into three groups.
- Then I ‘promote’ different things to the three groups:
- Promoters ==> share on social, rate, leave a testimonial
- Neutral ==> give me feedback on how to improve
- Detractors ==> feedback & refund”
“We have a dedicated customer support team that goes through the NPS detractors one by one, attempting to contact each feasible detractor (by phone where possible) to see what we could have done better – most times, we can turn a detractor into a future promoter simply through this contact.”
The second-most used method to measure customer happiness was conversations with customers. These happened primarily over the phone, with a few people having in-person meetings at their customers’ offices. A few people noted that they use support tickets as a way to understand customer sentiment.
“What I do is I personally do support once in a while to get a feel of how our customers are doing.”
Retention was tracked as an indicator of customer happiness by 11% of the people who responded. A few people mentioned that they review retention with the rest of their team to share and discuss customer sentiment.
“We have red flag process where certain keywords or actions by a customer trigger the customer being tagged as red flag. Then we hold weekly retention calls to go over these customers and any cancelling customers. On the call is our product management team and our customer success team.”
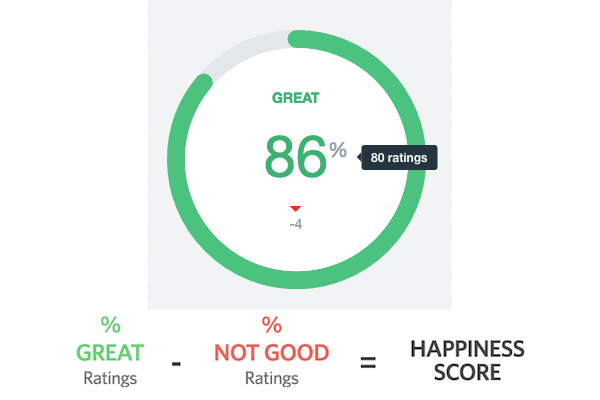
Customer Satisfaction Score (CSAT), which is a simple method to calculate customer satisfaction, was used by 6% of respondents. It’s a one-question survey that asks “How satisfied were you with your experience?” with a corresponding scale to measure it.
There were two other customer happiness surveys mentioned in the responses.
One method used was a simple happy or not happy to get a sense of customer sentiment: “Our ticketing system (ZenDesk) sends an automated ask when we close a ticket with a simple ‘happy’ or ‘not happy’.” The second was the Help Scout happiness score, which one company said they append to their email support conversations to get quick feedback from customers.
One person who measures churn also said that if customers are leaving, they assume it’s because those folks are unhappy with the product.
“Happy customers stick around, unhappy customers don’t.”
On the other hand, if customers are happy, they are likely paying and evangelizing the product to other people. This sentiment was shared by a handful of people, like this person:
“A ‘happy’ customer pays monthly and at best, expands their user counts and/or signs multi-year deals… the ‘happiest’ act as a referral and/or refer us to another buyer.”
One person mentioned taking overall customer feedback and looking at word clouds to understand how customers feel about the product.
“Every year, we run analysis of the words used by customers to describe the service & their incidence. We compare to prior year. For example, ‘easy; was mentioned 12% of the time in 2017, and 9% of the time in 2018 (to date). ‘Powerful’ has gone from 4% to 9% in the same period.”
Despite the different ways that people measure customer happiness, NPS still comes out on top.